

Let's pretend you've just opened up a new grocer on the high street, and you've just received an extra-large delivery of apples. Your business goal is to sell all the apples by the end of week at as high a profit margin as is possible. But, the problem is, that you don't know how much to charge per apple. It could be that a change in the price of an apple will affect the number of apples you sell, thereby significantly affecting your profit. It could also be that changing the price of an apple doesn’t affect the number of apples you sell at all (within a wide price range.) Clearly, there is some relationship between the number of items you sell, and the price you sell it at, and this is called price elasticity by economists. More formally, price elasticity is the study of how the quantity of an item demanded is affected by a change in the price of that item.
 Typically, we say an item is price elastic if a change in the price of the item significantly affects the quantity demanded. We as consumers all have an intuitive understanding of price elastic items - if people usually buy apples from the grocer down the road at 50p an apple, and now they are only 10p per apple, we’ll feel like we are getting a bargain and might buy a few of them. So a lower than normal price per apple has resulted in more apples being sold. Conversely, if an apple is now £1.50, people probably won’t buy many apples. Generally, for price elastic items, we assume an inverse relationship between price and quantity; that is to say, as price increases the quantity demanded of that item decreases (exponentially), as shown in Figure 1 below in the left panel.
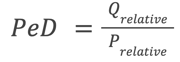
 On the other hand, an item is price inelastic if a change in the price of that item does not affect the quantity demanded. This might seem difficult to conceive of at first, but, an example of this is petrol. If you travel to work in your vehicle you need petrol, no matter how petrol varies in price, you will always consume generally the same amount month-on-month. In effect, the price of petrol doesn’t really affect how much of it you buy. For price inelastic items we assume a linear relationship, as shown in Figure 1 on the right below.
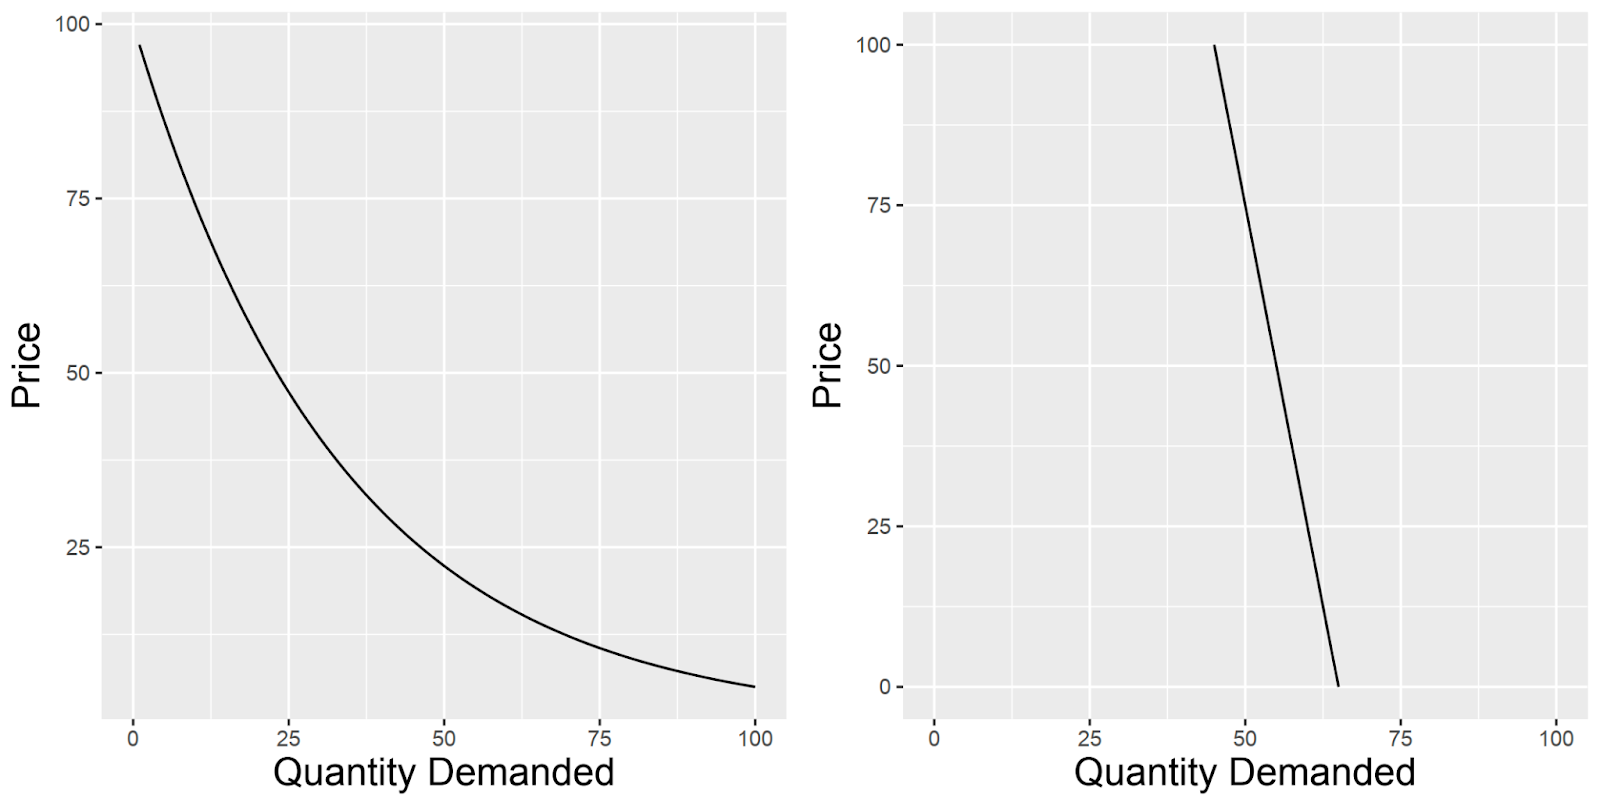
Figure 1. Price elasticity curves for a price elastic item (left panel), and a price inelastic item (right panel).
Importantly, when we assess price elasticity, we assume that the quality of the item remains constant. In our case, that means that each apple we sell is as good quality as are all the other apples in our store, or that each vat of petrol is equal to every other vat.
Definition of elastic and inelastic prices
Now that we understand pricing elasticity, how do we define an item as price elastic or inelastic? For this, we turn to the Price Elasticity of Demand (PeD) equation:
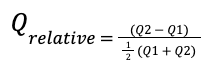
This simple equation looks at the ratio of the relative change in quantity demanded (Qrelative), and the relative change in price (Prelative). Essentially, we are asking “if the unit price for an item has changed a lot, does the quantity demanded for that item also change a lot”. For this equation, we need at least two pairs of data points - the quantities of items sold at two different prices. So in effect, the quantity of an item sold (Q1) at a price (P1), and the quantity of an item sold (Q2) at a different price (P2). Qrelative and Prelative are then respectively:
 and
and 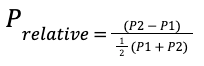
Using the PeD value, economists have devised a simple metric by which to define an item as elastic or inelastic. Firstly, we only examine the absolute value of the PeD value (i.e., we ignore a negative value.) This simplifies the interpretation and analysis of elasticities; rather than worrying about the direction of the relationship (indicated by the positive or negative sign of the PeD value), taking the absolute value allows us to focus on the magnitude of the relationship, which is more interesting as it allows comparisons of two or more elasticities. If the PeD value > 1 we have an elastic price in demand (Figure 1, left panel.) The interpretation is that a 1% change in price will result in a >1% change in quantity demanded. Since we assume an inverse relationship between price and quantity demanded, this means that if we increase the price of our item by 1%, we would expect a >1% decrease in quantity demanded. And conversely, if we decrease the price of our item by 1%, we would expect a >1% increase in quantity demanded. This is very useful to us as a grocer if our goal as previously stated was to sell all our apples by the end of the week: if stock isn’t moving very quickly during the first half of the week, we could reduce the price per apple which should greatly increase the quantity of apples sold.
Conversely, If the PeD value < 1 we have inelastic demand (Figure 1, right panel.) This means that for a 1% increase in price, the quantity demanded changes by < 1%, so changing the price doesn’t have a big effect on the quantity. In these cases, we can typically price our items higher, because it won’t affect the quantity demanded by too much.
Example
Let’s drive this home by way of an example and return to our previous scenario as a grocer trying to sell all our apples by the end of the week. Let’s say that we usually sell apples at 62p per apple. At this price, we typically sell 40 apples per day. We are interested in understanding the price elasticity of our apples, so we run an experiment for a day in which we reduce the price from 62p to 50 p and sell 60 apples. We now have enough data to plug into our PeD equation: P1(62), Q1(40), P2(50), Q2 (60). So let’s plug in our values, starting with Q_relative:
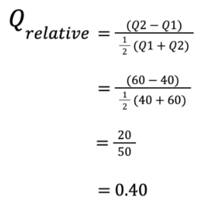
Similarly for P_relative:
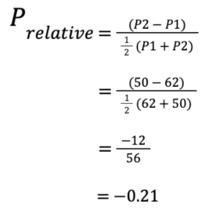
And we can plug back into our PeD equation (1):
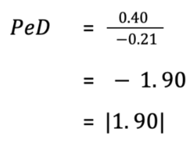
Ignoring the negative sign, this PeD value tells us that our apples are quite price elastic. If we are trying to sell all our apples by the end of the week, the good news is that we can reduce the price of apples and we are sure to increase the quantity of apples sold. In fact, we can use the PeD equation to find the exact price we would need to sell apples for in order to move the rest of our remaining stock by the end of the week! This is the field of price optimisation, but that is for another post.